


Bitcoin Price Analysis: BTC/USD hovers below $9,000 as the market hits a pause button after volatile pre-halving sessions – Confluence Detector
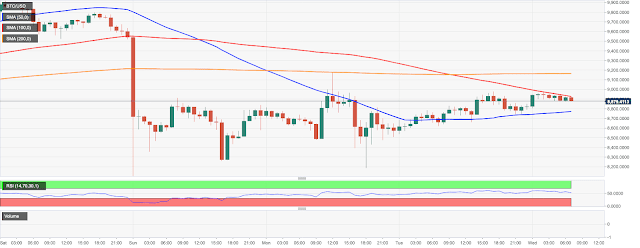

BTC/USD recovery capped by 1-hour SMA100.
The local support is created by 38.2% Fibo retracement monthly.
Bitcoin price has gained 2% on a day-to-day basis and stayed unchanged since the start of Wednesday. The first digital coin recovered from the intraday low of $8,806 to trade at $8,920 at the time of writing. The recovery is capped by 1-hour SMA100. This barrier prevents BTC from moving towards $9 000. Once it is cleared, the recovery may be extended towards $9,200 guarded by 1-hour SMA200.
While the short-term momentum remains bearish, the RSI on the intraday charts has reversed to the downside, which means, the coin may stay range-bound in the nearest future.
Let’s have a closer look at support and resistance levels clustered around the current price.
Resistance levels
$9,200 – 1-hour SMA200, 4-hour SMA40, daily SMA10
$9,500 – 38.2% Fibo retracement weekly, the highest level of the previous week, Pivot Point 1-day Resistance 3
$10,000 – psychological level
Support levels
$8,800 – 1-hour SMA50, 4-hour SMA100, the middle line of the 4-hour Bollinger Band
$8,500 – the lowest level of the previous day and the lowest level of the previous week
$8,200 – 38.2% Fibo retracement monthly.


Post Comment